Intersection points of curves
We often need to compute the points where two lines intersect or where a function intersects the x-axis (zero crossing). Here, we provide a Python script that does precisely that. Computes the points where two curves (lines, time series, etc.) intersect.
Hence, we provide a simple Python code that can compute the points $(x, y)$ where two curves, $ f(t) $ and g(t), intersect. The first step, and the easy one, is to take two points, one from each curve, $ (t_1, Y_f) $, and $ (t_1, Y_g) $, compute their distance, and check if it is smaller than an $ \epsilon $, where $ \epsilon $ is a tiny number close to zero. If that’s the case, then we are done and have found the intersection point being $ (t_1, Y_f) $. However, if the distance is larger than $ \epsilon $, we have to check for any crossing point. We first consider a new function $ h(t) = f(t) - g(t $, and we evaluate that function on the points $ (t_0, Y_f^0) $, $ (t_0, Y_g^0) $, $ (t_1, Y_f^1) $, and $ (t_1, Y_g^1) $. Thus, we obtain $ \delta_0 = Y_f^0 - Y_g^0 $ and $ \delta_1 = Y_f^1 - Y_g^1 $. If the product $ \delta_0 \delta_1 < 0 $, then from Bolzano’s theorem, we know that the two lines must intersect, and the intersection point $ (t^{\ast}, y^{\ast}) $ is:
$$ (t^{\ast}, y^{\ast}) = \Big( \frac{-t_0 \delta_1 + t_1 \delta_0}{\Delta}, \frac{Y_f^0 Y_g^1 - Y_f^1 Y_g^0}{\Delta} \Big), $$ where $ \Delta = Y_f^0 - Y_g^0 - Y_f^1 + Y_g^1 $. The coordinates of the point $ (t^{\ast}, y^{\ast}) $ are derived by computing the following determinant(s) (which gives us the intersection point):

When one runs the Python code provided in the above snippet, one obtains the results shown in the Figure below.
 1import numpy as np
 2import matplotlib.pylab as plt
 3import matplotlib.style as style
 4
 5style.use('tableau-colorblind10')
 6
 7params = {'font.size': 14,
 8          }
 9plt.rcParams.update(params)
10
11eps = 1e-12
12
13
14def findCrossings(X, Y, t=None):
15    if len(X) != len(Y):
16        raise ValueError
17
18    if t is None:
19        t = np.arange(len(X))
20
21    crossings = []
22    deltaOld = 0
23    tPrev, xOld, yOld = None, None, None
24    for tCurr, xNew, yNew in zip(t, X, Y):
25        deltaNew = yNew - xNew
26        # When the difference of two points is virtually zero then accept that
27        # as a crossing point (x, y)
28        if np.abs(deltaNew) < eps:
29            crossings.append((tCurr, xNew))
30        # Otherwise check if the product of the differences is negative and then
31        # from Bolzano's theorem we know that there should be a crossing. To find
32        # the intersection we compute the determinant as it is defined in the text
33        # above and compute the crossing point (x, y)
34        elif deltaNew * deltaOld < 0:
35            denom = deltaOld - deltaNew
36            crossings.append(((-deltaNew * tPrev + deltaOld * tCurr) / denom,
37                              (xNew * yOld - yNew * xOld) / denom))
38        tPrev, xOld, yOld, deltaOld = tCurr, xNew, yNew, deltaNew
39    return crossings
40
41
42def nicePlot(t, x, y, crossing_pts, ax):
43    """ A simple plotting function
44    """
45    ax.plot(t, x, 'b-', alpha=0.7, lw=2)
46    ax.plot(t, y, 'k-', alpha=0.7, lw=2)
47    ax.plot(*zip(*crossing_pts),
48            ls="",
49            color='orange',
50            marker='o',
51            alpha=1.,
52            ms=10)
53    ax.set_xticks([])
54    ax.set_yticks([])
55
56
57if __name__ == "__main__":
58    N = 20
59
60    fig = plt.figure(figsize=(19, 5))
61    ax = fig.add_subplot(131)
62    # Two curves that do not intesect thus no crossing points
63    t = np.linspace(-np.pi, np.pi, N)
64    x = np.sin(t * .08+1.4)*np.random.uniform(0.5, 0.9) + 1
65    y = -np.cos(t * .07+.1)*np.random.uniform(0.7, 1.0) + 1
66    crossing_pts = findCrossings(x, y, t=t)
67    nicePlot(t, x, y, crossing_pts, ax)
68
69    # Two time series intesecting at multiple points
70    ax = fig.add_subplot(132)
71    t = np.arange(N)
72    x = np.random.normal(0, 1, (N,))
73    y = np.random.normal(0, 1, (N,))
74    crossing_pts = findCrossings(x, y, t=t)
75    nicePlot(t, x, y, crossing_pts, ax)
76
77    # x^2 intersecting at two points with the line x
78    ax = fig.add_subplot(133)
79    t = np.linspace(-1, 1, N)
80    x = t**2
81    y = t
82    crossing_pts = findCrossings(x, y, t=t)
83    nicePlot(t, x, y, crossing_pts, ax)
84
85    plt.show()
When one runs the Python code provided in the above snippet then they obtain the results shown in the Figure below.
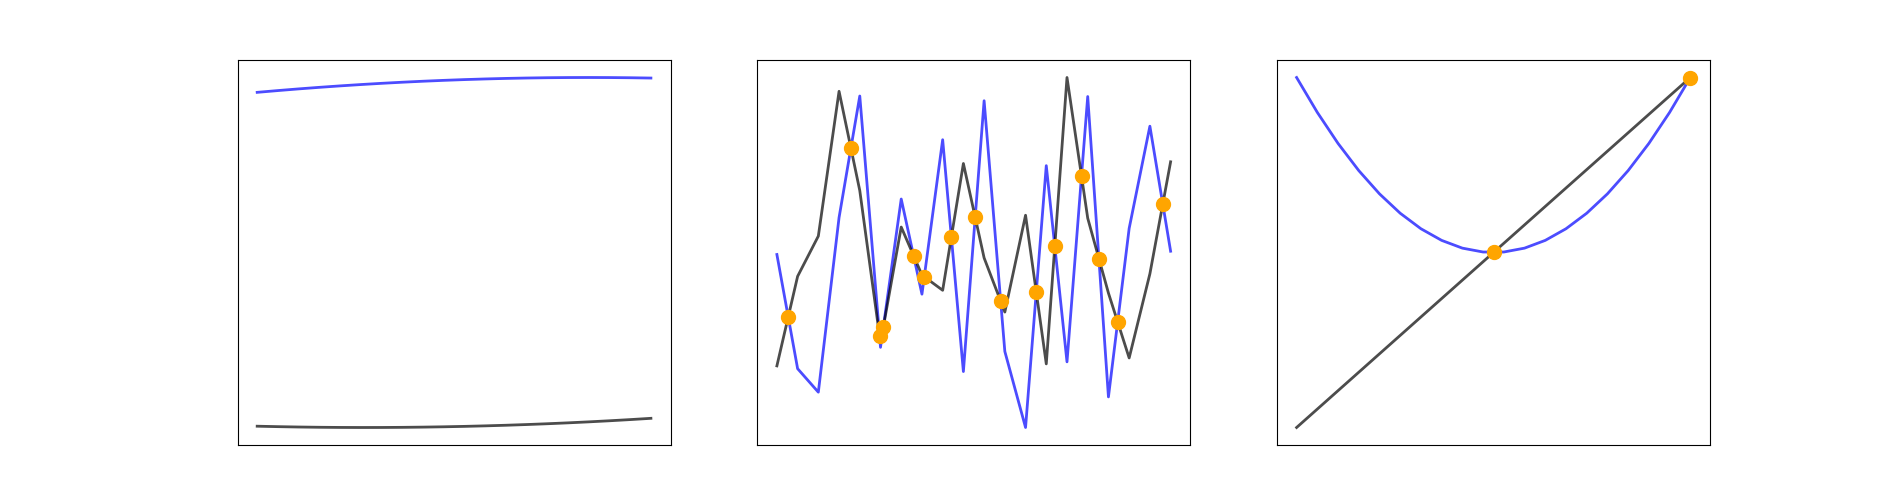
Figure 1. Three exampels of identifying crossing points between two curves. The orange discs indicate the crossing points.