How do we verify linear separability with Python?
Two sets $ A $ and $ B $ in an $ n $ dimensional Euclidean space are linearly separable if there exist $ n + 1 $ numbers $ w_i \in \mathbb{R} $ such that every point $ a \in A $ satisfies
$$ \sum_{i=1}^{n}w_i a_i > k, $$
and every point $ b \in B $ satisfies
$$ \sum_{i=1}^{n}w_i b_i < k, $$
where $ k \in \mathbb{R} $ defines a linear border (e.g., a line) between data points of the two sets.
In layperson’s terms, let’s say we have two two-dimensional data sets (e.g., each data point is described by two coordinates, x and y). These two sets are linearly separable if we can draw at least one line that will separate the points of set A from those of set B.
Many times we have to solve a classification or clustering problem. If we could know a priori that the involved sets are linearly separable, we could choose the appropriate classification algorithm. For instance, if the data sets are not linearly separable, we won’t be able to use a linear classifier.
Therefore, one way to know if the sets at hand are linearly separable is to
compute the convex hull of each set and check if those convex hulls intersect
or one contains the other, or they overlap. If any of those three conditions
is true, then we know that the two sets are not linearly separable.
In Python, we can quickly check that using the function ConvexHull of
Scipy. Here is an example:
 1import matplotlib.pylab as plt
 2
 3from sklearn.datasets import make_moons, make_blobs
 4from scipy.spatial import ConvexHull
 5
 6
 7if __name__ == '__main__':
 8    S = 8       # size of scatter plot point
 9    blobs = make_blobs(n_samples=100, centers=2, random_state=13)
10    moons = make_moons(n_samples=100)
11
12    fig = plt.figure(figsize=(13, 11))
13    ax1 = fig.add_subplot(221)
14    Xb, Yb = blobs
15    x1b = Xb[Yb == 0]
16    x2b = Xb[Yb == 1]
17    ax1.scatter(x1b[:, 0], x1b[:, 1], s=S)
18    ax1.scatter(x2b[:, 0], x2b[:, 1], c="orange", s=S)
19    ax1.set_xticks([])
20    ax1.set_yticks([])
21
22    ax2 = fig.add_subplot(222)
23    X, Y = moons
24    x1 = X[Y == 0]
25    x2 = X[Y == 1]
26    ax2.scatter(x1[:, 0], x1[:, 1], s=S)
27    ax2.scatter(x2[:, 0], x2[:, 1], c="orange", s=S)
28    ax2.set_xticks([])
29    ax2.set_yticks([])
30
31    ax3 = fig.add_subplot(223)
32    ch1 = ConvexHull(x1b)			# Compute the convex hull
33    ax3.scatter(x1b[:, 0], x1b[:, 1], s=S)
34    ax3.plot(x1b[ch1.vertices, 0], x1b[ch1.vertices, 1], lw=2, c='k')
35    ch2 = ConvexHull(x2b)
36    ax3.scatter(x2b[:, 0], x2b[:, 1], s=S)
37    ax3.plot(x2b[ch2.vertices, 0], x2b[ch2.vertices, 1], lw=2, c='k')
38    ax3.set_xticks([])
39    ax3.set_yticks([])
40
41    ax4 = fig.add_subplot(224)
42    ch1 = ConvexHull(x1)
43    ax4.scatter(x1[:, 0], x1[:, 1], s=S)
44    ax4.plot(x1[ch1.vertices, 0], x1[ch1.vertices, 1], lw=2, c='k')
45    ch2 = ConvexHull(x2)
46    ax4.scatter(x2[:, 0], x2[:, 1], s=S)
47    ax4.plot(x2[ch2.vertices, 0], x2[ch2.vertices, 1], lw=2, c='k')
48    ax4.set_xticks([])
49    ax4.set_yticks([])
50
51    plt.savefig("convec_hulls.png")
52    plt.show()
If we run the source code in the snippet above, we get the results shown in Figure 1. For the blobs, the two sets are $hand, the moons data are not linearly separable because of their convex hull intersections.
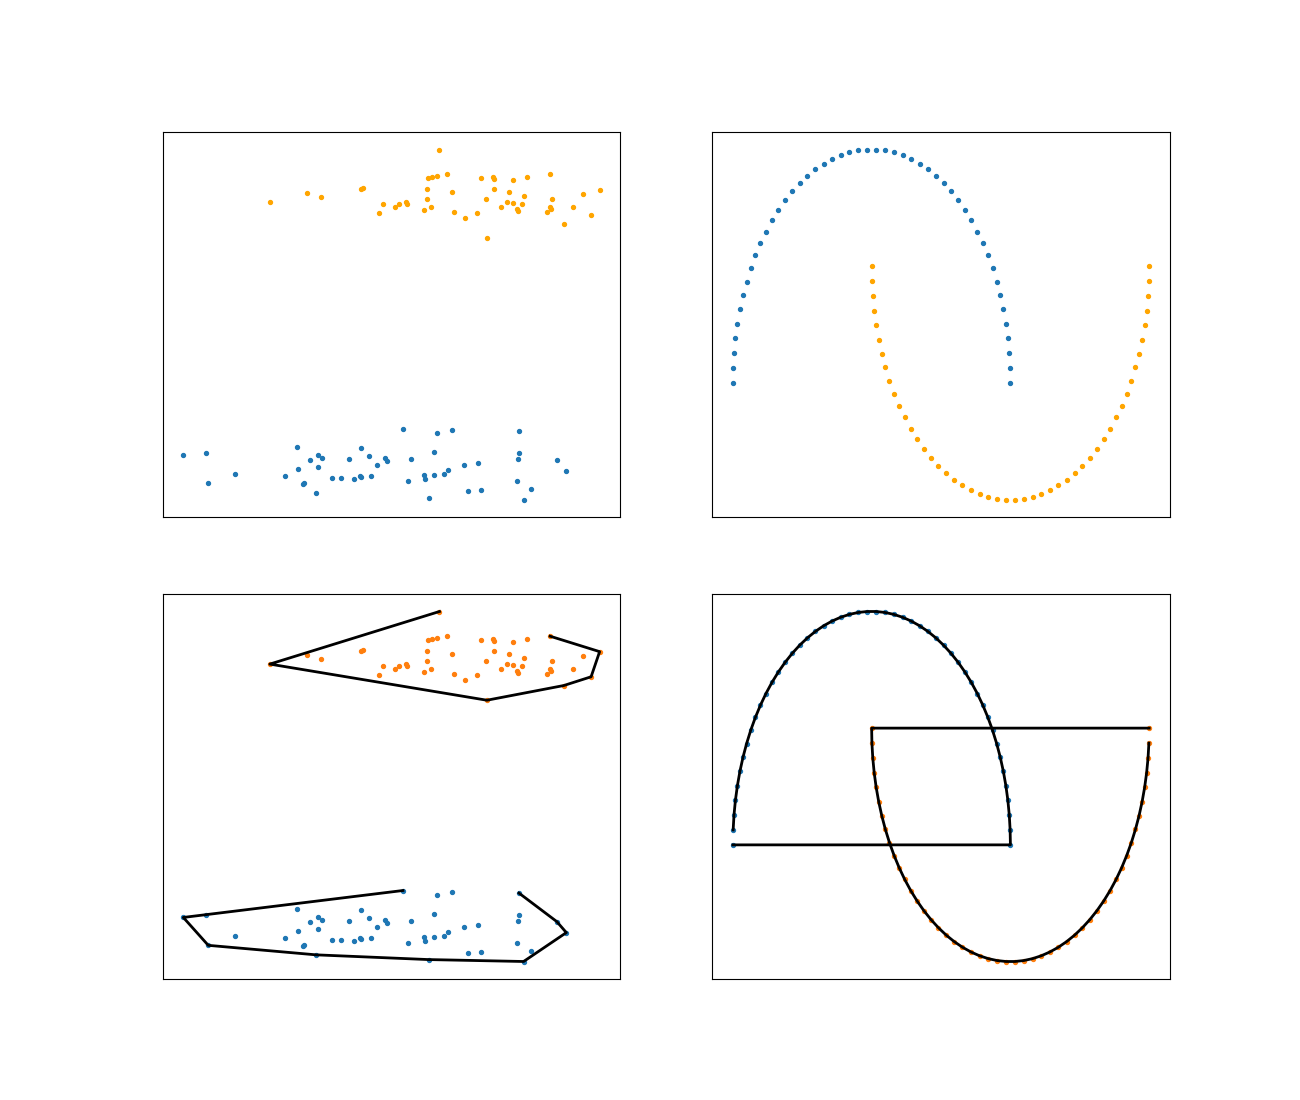
Figure 1. Blobs and moons data sets along with their convex hulls. The blobs are linearly separable since the convex hull of the blue set does not intersect or overlap with the convex hull of the orange data set. On the other hand, the moons data set is not linearly separable.